Fix "ChatGPT Unable to Display Visualization" Errors: All You Need to Know
When working with ChatGPT, many users encounter the frustrating "unable to display visualization" error message. This comprehensive guide explores why this happens and provides practical solutions to get your charts, graphs, and visual content working properly.
Why is ChatGPT Unable to Display Visualizations?
ChatGPT's visualization capabilities are limited by several technical constraints. The platform doesn't have native image generation or chart creation abilities in all contexts. When you request a visualization, ChatGPT may attempt to create code that generates charts, but display issues often arise due to:
Technical Limitations:
-
Browser compatibility issues with certain chart libraries
-
JavaScript execution restrictions in the ChatGPT interface
-
Memory limitations when processing complex datasets
-
API restrictions that prevent direct image rendering
Data Processing Constraints:
-
Large datasets that exceed processing limits
-
Incompatible file formats or corrupted data
-
Missing dependencies required for visualization libraries
-
Network connectivity issues affecting external resources
The "chatgpt says unable to display visualization" error commonly appears when users try to create complex charts from Excel data, generate interactive dashboards, or display real-time data visualizations through third-party applications.
Common Scenarios: Users Share Their Experiences
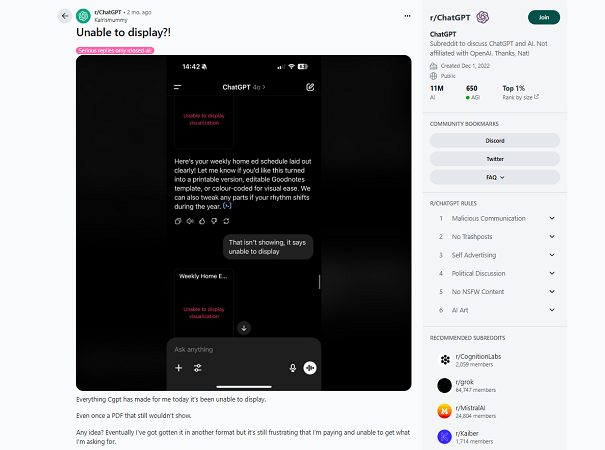
Based on discussions across Reddit and OpenAI communities, several patterns emerge regarding ChatGPT visualization failures:
Excel Integration Issues:
Many users report problems when trying to get ChatGPT to display visualizations from Excel data. The "chatgpt unable to display visualization excel" issue typically occurs when:
-
Excel files contain complex formulas or macros
-
Data formatting is inconsistent across columns
-
File sizes exceed ChatGPT's processing capabilities
-
Special characters or non-standard encoding cause parsing errors
Mobile App Limitations:
The "chatgpt unable to display visualization app" problem is particularly common on mobile devices. Reddit users frequently mention that visualizations work on desktop but fail on mobile due to:
-
Limited processing power on mobile devices
-
Touch interface incompatibility with interactive charts
-
Reduced JavaScript support in mobile browsers
-
Screen size constraints affecting chart rendering
Platform-Specific Errors:
Different ChatGPT interfaces (web, mobile app, API integrations) handle visualizations differently, leading to inconsistent user experiences across platforms.
Troubleshooting ChatGPT Visualization Errors
When you encounter the "chatgpt error unable to display visualization" message, try these systematic troubleshooting steps:
Step 1: Simplify Your Request
-
Break complex visualizations into smaller components
-
Reduce dataset size by sampling or filtering data
-
Request basic chart types (bar, line, pie) before advanced visualizations
-
Avoid requesting multiple charts in a single prompt
Step 2: Check Data Format
-
Ensure your data is properly formatted and clean
-
Remove special characters that might cause parsing issues
-
Verify column headers are clear and consistent
-
Convert large Excel files to CSV format for better compatibility
Step 3: Browser and Platform Solutions
-
Refresh your browser and clear cache
-
Try a different browser (Chrome, Firefox, Safari)
-
Switch from mobile to desktop if possible
-
Disable browser extensions that might interfere with JavaScript
Step 4: Alternative Approaches
-
Request the underlying code instead of direct visualization
-
Ask for data in table format first, then create charts separately
-
Use ChatGPT to generate code for external visualization tools
-
Copy generated code to platforms like Google Colab or Jupyter notebooks
Alternative Solutions for ChatGPT Visualization Errors
When ChatGPT cannot generate charts or images directly, consider these effective alternatives:
Code Generation Approach:
Instead of asking ChatGPT to display visualizations, request code that you can run elsewhere:
-
Python matplotlib or seaborn code for statistical plots
-
JavaScript D3.js or Chart.js code for web-based charts
-
R ggplot2 code for advanced statistical visualizations
-
SQL queries that can be visualized in business intelligence tools
External Platform Integration:
-
Google Sheets: Import ChatGPT-generated data and create charts
-
Tableau Public: Use ChatGPT to prepare data for professional visualizations
-
Power BI: Leverage ChatGPT for data analysis, then visualize results
-
Online chart makers: Tools like Plotly, Canva, or ChartGo
Step-by-Step Visualization Process:
-
Use ChatGPT to analyze and clean your data
-
Generate summary statistics and insights
-
Create data tables in the optimal format
-
Export or copy data to your preferred visualization tool
-
Apply ChatGPT's analytical insights to chart design
Mobile-Specific Solutions:
For users experiencing "ChatGPT unable to display visualization app" issues:
-
Use the web version instead of mobile apps
-
Request text-based data summaries that work better on mobile
-
Generate code that can be run on mobile-friendly platforms
-
Save generated data for later visualization on a desktop
Final Thoughts
While ChatGPT's " unable to display visualization " message may limit direct chart rendering, understanding its constraints helps users develop effective workarounds. ChatGPT excels at data analysis, code generation, and offering visualization strategies, even if it doesn't display charts directly. A hybrid approach using ChatGPT for analysis and dedicated tools for final visuals often yields more flexible and professional results than relying on ChatGPT alone.
As AI technology continues evolving, these limitations may be addressed in future updates. Meanwhile, the solutions outlined above ensure you can still create compelling visualizations using ChatGPT as a powerful analytical assistant.
FAQs
What does "ChatGPT says unable to display visualization" mean?
This error message means that ChatGPT is unable to render or show a visual element, such as a chart, graph, molecule structure, or image, due to issues like technical glitches, content policy violations, file access errors, or platform-specific limitations (e.g., mobile app vs. web).
Why is my visualization not working in ChatGPT?
It could be due to bad input format, browser incompatibility, or platform limitations that prevent image/chart rendering.
Why is ChatGPT not displaying anything?
This may indicate connectivity issues, browser extension conflicts, or an expired session.
What can I do if ChatGPT cannot generate charts or images?
Request the underlying code instead, use external visualization tools, simplify your data, or break complex requests into smaller components. Consider platforms like Google Sheets, Python notebooks, or online chart makers for final visualization creation.
You Might Also Like
- Unable to Upload Image in ChatGPT? Here’s How to Fix It
- Can’t Download Files from ChatGPT? Help You Solve Here
- ChatGPT 5 is Bad. How to Go Back to ChatGPT 4o?
- How to Delete ChatGPT History Faster: All Right Ways Are Here
- Latest News! Fix ChatGPT 5 Not Showing Up Issue
- How to Fix ChatGPT Temporary Chat Not Working Issue

Tenorshare AI Slides – Create Slides in Seconds
Professional, customizable and free template available.Tenorshare AI Slides, Make PPT Instantly
Generate slides in one click.
Tenorshare AI Slides – Create Slides in Seconds