How to Insert and Customize Graphs in PowerPoint: A Complete Guide
Inserting graphs and charts into your PowerPoint presentations can significantly enhance your ability to convey complex data in a clear and engaging manner. How to insert graph in PowerPoint is a crucial skill, especially when you want to present data that needs to be understood at a glance. Whether you're working on a business proposal, an academic presentation, or a personal project, knowing how to insert chart in PowerPoint can save you time and improve the overall impact of your presentation.
Types of Charts in PowerPoint
PowerPoint offers a variety of chart types, each suited to different data visualization needs:
Bar Charts: Ideal for comparing different categories.
Line Charts: Best for showing trends over time.
Pie Charts: Useful for illustrating proportions within a whole.
Scatter Plots: Perfect for showing relationships between two variables.
-
Area Charts: Great for showing cumulative data over time.
Understanding the strengths of each chart type will help you make informed decisions about which to use for your specific presentation. For instance, if you're comparing sales figures across different regions, a bar chart might be most effective. On the other hand, if you're showing changes in market share over several years, a line chart would be more appropriate.
How to Insert a Graph in PowerPoint
Now that you know the different types of charts available, let's walk through how to insert graph in PowerPoint.
Open PowerPoint and navigate to the slide where you want to insert the graph.
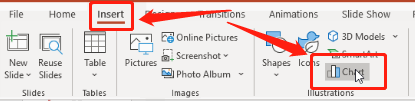
Click on the 'Insert' tab in the top menu, then select 'Chart' from the dropdown.

Choose the chart type that best fits your data (e.g., bar, line, pie).
A spreadsheet will open within PowerPoint where you can input your data. Once you’ve entered your data, the graph will automatically update.
Customize the chart by clicking on it and using the 'Chart Design' options to adjust colors, labels, and more.


If you need to insert chart in PowerPoint that’s more complex, such as one that includes multiple data series or customized axes, PowerPoint offers advanced charting options that you can explore through the 'Chart Tools' menu.
How to Draw Graph in PowerPoint
Sometimes, pre-built charts might not fully meet your needs, and you may want to manually draw a custom graph. Here’s how to draw graph in PowerPoint:
Go to the 'Insert' tab and select 'Shapes'.
Choose the shape that represents the data point you want to illustrate, such as a line, rectangle, or circle.
Click and drag on the slide to draw the shape.
Use the 'Format' options to adjust the size, color, and positioning of the shapes.
Combine multiple shapes and lines to build your custom graph.
This approach is ideal for unique data representations that standard charts can't capture, such as custom timelines, hierarchical structures, or specialized infographics.
How to Insert a Graph in PowerPoint from Excel
For many users, the data they want to visualize is already in Excel. Here’s how to insert a graph in PowerPoint directly from Excel:
Open your Excel file containing the data you want to use.
Create the chart in Excel by selecting your data and choosing 'Insert' > 'Chart'.
Copy the chart (Ctrl + C).
Go to your PowerPoint slide, and paste the chart (Ctrl + V). The chart will now appear in your slide.
If you need the chart to update automatically when the Excel data changes, ensure you paste it as a linked object by selecting 'Paste Special' > 'Paste Link'.
This method is particularly useful for dynamic presentations where data might change before your final presentation. By linking the chart, any updates in Excel will be reflected in your PowerPoint slide.
Tenorshare AI Slides
- Free AI Presentation Maker for One-Click Professional Slides in Minutes
- Free Export for All Your Presentation Needs
- Advanced Text and Language Options
- Tailor Your Presentations to Perfection with Our Templates
FAQs
How to Insert Graph in PowerPoint Online
To insert a graph in PowerPoint online, the process is similar to the desktop version. However, some advanced features might be limited, so ensure your data is well-prepared in advance.
How to Make a Graph in PowerPoint Mobile
Creating a graph in PowerPoint mobile is possible, but the process is simplified. You can insert basic charts, but for more detailed customization, it’s best to use the desktop version.
How to Make a Line Graph in PowerPoint
To make a line graph in PowerPoint, select the 'Line' chart type from the 'Insert' > 'Chart' menu. Enter your data into the spreadsheet that appears, and your line graph will be created automatically.
Conclusion
Incorporating graphs and charts into your PowerPoint presentations is a powerful way to communicate data effectively. Whether you’re showing sales trends, market analysis, or academic findings, knowing how to insert graph in PowerPoint and how to insert chart in PowerPoint can significantly enhance the clarity and impact of your message. Remember to choose the right type of chart for your data, customize it to match your presentation's style, and consider the needs of your audience to ensure your data is presented in the most effective way possible.
You Might Also Like
- How to Add and Edit Videos in PowerPoint: Step-by-Step Tutorial
- How to Easily Translate PowerPoint Slides: A Quick Guide
- Mastering Theme Customization: How to Change and Apply Themes in PowerPoint
- How to Translate Google Slides into Different Languages
- How to Convert Google Slides to PDF: A Step-by-Step Guide
- Comprehensive Guide: How to Insert, Edit, and Remove Text Boxes in PowerPoint

Tenorshare AI Slides – Create Slides in Seconds
Professional, customizable and free template available.Tenorshare AI Slides, Make PPT Instantly
Generate slides in one click.
Tenorshare AI Slides – Create Slides in Seconds