How to Insert a Map in PowerPoint - Step-by-Step Tutorial
Maps in PowerPoint presentations are invaluable tools for visualizing geographic data, enhancing audience engagement, and conveying complex information in an easy-to-understand format.So, how to Insert a Map in PowerPoint?
Why You Need to Know How to Insert a Map in PowerPoint
Whether you're presenting market analysis, planning logistics, or teaching geography, maps can greatly improve communication. Here are three key pain points that maps in presentations address:
Enhanced Spatial Understanding: A visual representation of data helps audiences quickly grasp spatial relationships and geographic scales.
Improved Presentation Aesthetics: Maps add a professional touch to presentations, making them more engaging and visually appealing.
Effective Data Presentation: Maps allow for the efficient display of data across different regions, making complex data sets accessible and understandable.
In addition to these benefits, it's crucial to integrate tools like fillable map for ppt and utilize powerpoint map templates to streamline the creation and customization of your maps.
How to Insert a Map in PowerPoint
Inserting a map into your PowerPoint presentation can be straightforward. Follow these steps:
Open your PowerPoint presentation and navigate to the slide where you want to insert the map.
Go to the Insert tab, click on 'Shapes,' and select 'Maps' to choose from built-in geographic shapes.
Customize the map by resizing and positioning it on your slide.
How to Edit Maps in PowerPoint
Map Format
Editing the map format involves adjusting the visual style and layout of your map to better fit your presentation’s theme:
- Select the map.
- Use the 'Format' tab to change styles, colors, and effects.
Map Colors
To modify your map’s colors:
- Click on the map to activate the 'Format' tab.
- Choose 'Shape Fill' to select new colors for different areas of your map.
Text on the Map
Adding text to maps can highlight specific areas or data points:
- Select the map and choose 'Insert' > 'Text Box'.
- Click on the desired part of the map to add your text.
[Bonus] How to Create a Map in PowerPoint with Tenorshare AI Slide
Tenorshare AI Slides revolutionizes how you insert maps into PowerPoint by automating the creation process.
- Automatic Map Generation: Tenorshare AI Slide automatically creates maps based on the specifications you outline in your PowerPoint slide.
- Customizable Templates: Offers a variety of editable map templates that can be tailored to fit your presentation's needs.
- Seamless PowerPoint Integration: Integrates directly with PowerPoint, allowing for easy insertion and manipulation of maps within your presentation.
- Advanced Data Visualization: Supports the overlay of data sets on maps, ideal for detailed geographic or demographic analyses.
- User-Friendly Interface: Designed for ease of use, enabling users of all skill levels to generate professional-quality maps quickly.
Here’s how you can use this tool:
-
Generate Outline
Start by entering a topic or idea in the prompt-based creation field. Choose the number of slides and the language you want to use. Once ready, click "Generate Outline" to create the basic structure of your presentation.

Adjust Outline
After the outline is generated, you'll see a list of suggested slide titles. You can add, remove, or modify these slides as needed.
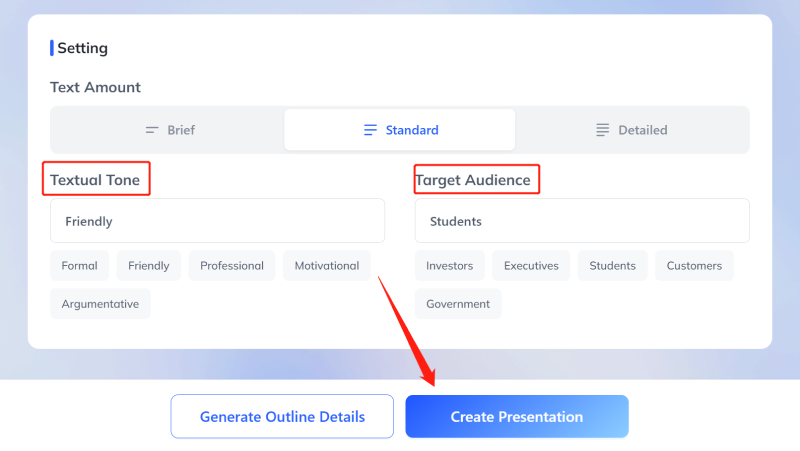
You can also adjust the settings for your presentation, including the amount of text, the tone, and the target audience.
Select Template
Next, click "Create Presentation" to choose a template from the wide selection available, designed to suit various themes and styles.
Export Presentation
Once your slides are complete, you can easily export your presentation in your preferred format—PowerPoint, PDF, or images. You can further edit the content in PowerPoint format to suit your specific needs.


FAQs
How to Put an ArcGIS Map on a PowerPoint
For ArcGIS maps, insert them by:
- Clicking 'Insert' > 'Object' in PowerPoint.
- Selecting 'ArcGIS Maps for Office' and following the prompts to embed your map.
How to Insert Google Map in PPT
To include a Google Map:
- Capture a screenshot of the desired Google Map.
- Insert the image into your PowerPoint slide via the 'Insert' > 'Image' option.
How to Edit Map in PowerPoint
Editing a map typically involves changing colors, adjusting sizes, or adding labels through the 'Format' tab.
How to Make a Route Map in PowerPoint
Create route maps by:
- Drawing lines or arrows between destinations using the 'Shapes' tool.
- Labeling each step for clarity and impact.
Conclusion
In today’s fast-paced world, the ability to quickly and effectively communicate ideas through presentations is invaluable. How to insert a map in PowerPoint and how to create a map in PowerPoint are essential skills for anyone looking to enhance their presentations with geographic data or visual aids. Tenorshare AI Slides simplifies this process, offering an intuitive platform that automates the creation of maps and slides, thus allowing you to focus on crafting your message rather than on time-consuming design tasks.
You Might Also Like
- How to Add Superscript and Subscript in PowerPoint for Accurate Formatting
- How to Use the Presenter View in Google Slides for a Seamless Presentation Experience
- How to Make a Poster in PowerPoint: Step-by-Step Guide
- How to Highlight Text in PowerPoint: Step-by-Step Guide for All Versions
- How to Add and Edit Videos in PowerPoint: Step-by-Step Tutorial
- How to Easily Translate PowerPoint Slides: A Quick Guide

Tenorshare AI Slides – Create Slides in Seconds
Professional, customizable and free template available.Tenorshare AI Slides, Make PPT Instantly
Generate slides in one click.
Tenorshare AI Slides – Create Slides in Seconds