
How to Use Desmos for SAT 2026: Master the Digital SAT Calculator
Struggling to finish SAT Math on time or constantly losing points to small calculator mistakes? You're not alone---and this is exactly why learning how to use Desmos for SAT matters . On the Digital SAT, it's not just about knowing math, but about using the right tool efficiently so you can solve problems faster and avoid unnecessary errors under time pressure.
In this guide, you'll learn how to use Desmos strategically for SAT Math , including how to graph equations, solve systems visually, test answer choices, and use advanced features like regression when needed. By the end, you'll know not just what Desmos can do, but when and how to use it to save time and improve your score.
Also Read: 15 Hardest Digital SAT Math Questions With Answers & Strategies
What Is Desmos on the SAT?

Desmos is the calculator system integrated into the Bluebook testing app. During the SAT Math section, students can switch between a graphing calculator and a scientific calculator. You can also bring an approved handheld calculator if you prefer using one you already know.
The graphing calculator is particularly useful because it lets you visualize equations and mathematical relationships instead of calculating everything manually.
The SAT version is not identical to every feature available on the regular Desmos website. For College Board exams, features such as images, folders, and notes are disabled in the graphing calculator. Desmos also provides a College Board testing version that students can use for practice.
Are We Allowed to Use Desmos During the SAT?
Yes. Desmos is officially allowed during the SAT Math section because it is built directly into Bluebook . Students can access the scientific or graphing version at any point during Math.
You cannot use a calculator during the Reading and Writing section .
Students may also bring an approved handheld calculator. However, College Board's current calculator policy prohibits calculators with computer algebra system (CAS) functionality and certain other restricted features. The built-in Bluebook Desmos calculator remains an approved option.
If you plan to rely on Desmos on test day, practice with it beforehand. College Board recommends becoming familiar with the calculator through Bluebook practice tests, the test preview, or Desmos itself.
How to Access and Use Desmos on the SAT
During a Math module in Bluebook, open the calculator tool and choose either the scientific or graphing calculator.
For most advanced Desmos strategies, you will want the graphing calculator.
The basic workflow is simple:
-
Open the calculator in Bluebook.
-
Switch to the graphing calculator when necessary.
-
Enter an equation or expression in the expression area.
-
Examine the graph or calculated result.
-
Click important points such as intersections or intercepts when they are relevant.
-
Adjust the graph window if the information you need is outside the visible area.
Tables are another useful tool. Desmos allows you to enter ordered pairs in a table, plot them automatically, and use the data for regression.
Before test day, it is better to practice with the official College Board version of the Desmos calculato r rather than assume every feature on the standard Desmos website will appear exactly the same way on the SAT.
Essential Desmos Skills Every SAT Student Should Know
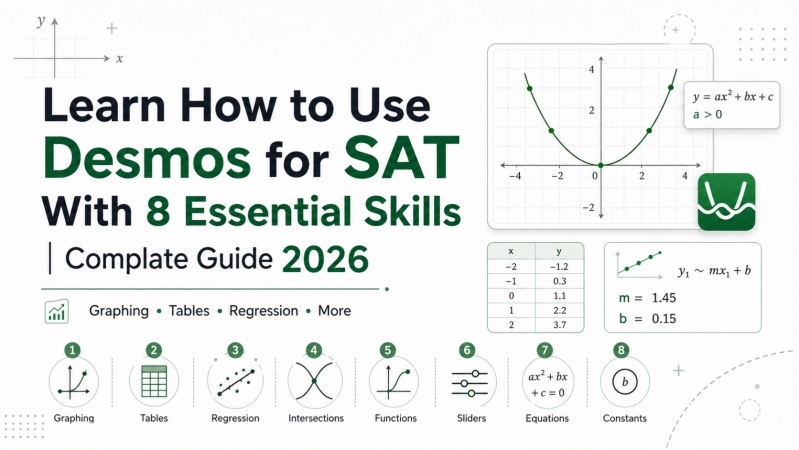
You do not need to learn every Desmos feature. For SAT Math, a smaller set of functions covers many useful situations.
Graph Equations
The most basic skill is entering equations and reading their graphs.
Suppose a problem gives:
y = x² - 5x + 6
Graphing it immediately lets you see the shape of the parabola and identify important points.
This can be useful when a question asks about:
-
x-intercepts
-
y-intercepts
-
maximum or minimum values
-
intersections
-
the number of solutions
-
characteristics of a function
Graphing is especially useful for checking algebra after solving a problem manually.
Find Intersections
When two equations are graphed at the same time, their intersection points represent values that satisfy both equations.
For example:
y = 2x + 1
y = -x + 7
Graph both equations and inspect where the two lines meet.
This provides a visual way to solve many systems of equations. SAT preparation guides commonly identify intersections as one of the most practical uses of Desmos for systems and graph-based questions.
Find Zeros and Intercepts
If an equation crosses the x-axis, the x-coordinate at that point represents a zero or root of the function.
For example, graph:
y = x² - 5x + 6
The x-intercepts correspond to solutions of:
x² - 5x + 6 = 0
This can save time when a problem asks for roots but does not require an algebraic derivation.
Use Tables
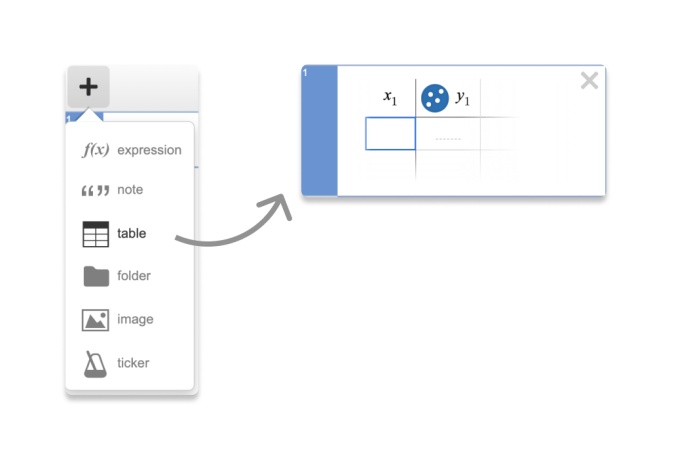
Tables are useful when a question gives several coordinate pairs or asks you to examine a pattern.
In Desmos, you can add a table and enter the x- and y-values. The points appear on the graph automatically. Tables can also be used as the starting point for regression models.
This is particularly helpful for:
- inear models
-
quadratic models
-
exponential models
-
scatterplots
-
finding equations from data
Use Sliders for Unknown Constants
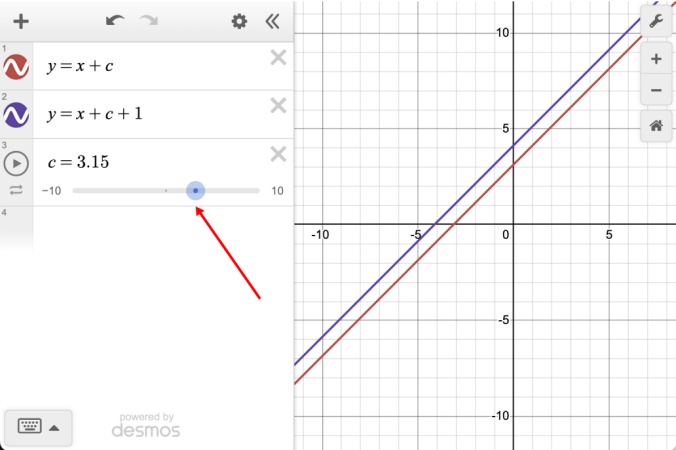
If you type an equation containing an undefined parameter such as a, b, m, or k, Desmos can create a slider for that parameter.
For example:
y = ax² + 3
Changing a lets you see how the graph changes.
For SAT problems involving an unknown constant, sliders can sometimes help you test what value produces the required graph behavior. SAT-focused Desmos guides commonly use sliders for conditions involving intercepts, coordinates, maxima, or other graph properties.
Sliders are most useful when the answer choices provide a small set of possible values. They are less efficient when exact algebra gives the answer immediately.
Graph Inequalities
Desmos can graph inequalities as shaded regions.
For example:
y ≥ 2x + 1
shows the region satisfying the inequality.
You can also graph multiple inequalities and inspect their overlapping regions. Desmos officially supports strict and non-strict inequalities as well as domain and range restrictions.
This can help with questions involving linear inequalities or systems of inequalities.
Use Basic Statistics Functions
Desmos supports statistical functions for working with data, including mean, median, standard deviation, and other descriptive statistics. Data can be entered directly, stored in a list, or entered in a table.
For a data set stored as L, for example, you can use functions such as:
mean(L)
median(L)
or:
stats(L)
This can reduce repetitive arithmetic on data-analysis questions.
Test Answer Choices
Sometimes the fastest use of Desmos is simply checking the options provided in a multiple-choice question.
If the question asks which equation matches a given condition, graphing the answer choices can help eliminate incorrect options quickly.
However, do not automatically graph four answers if the correct one can be identified in a few seconds using algebra. Desmos should save time, not create extra work.
How to Use Regression on Desmos for SAT
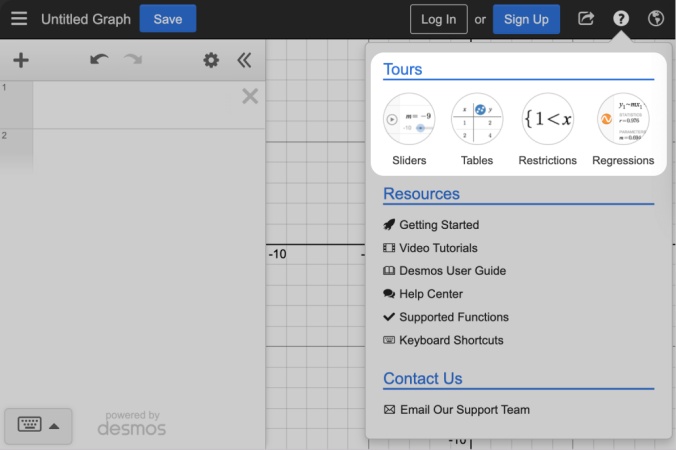
Regression is one of the more advanced ways to use Desmos for the SAT.
In general, regression finds a mathematical model that fits a set of data. Desmos supports built-in regression templates as well as custom regression models.
For SAT preparation, regression is especially useful when a problem gives several points and asks you to determine an equation or an unknown constant.
Method 1: Use Regression With a Table
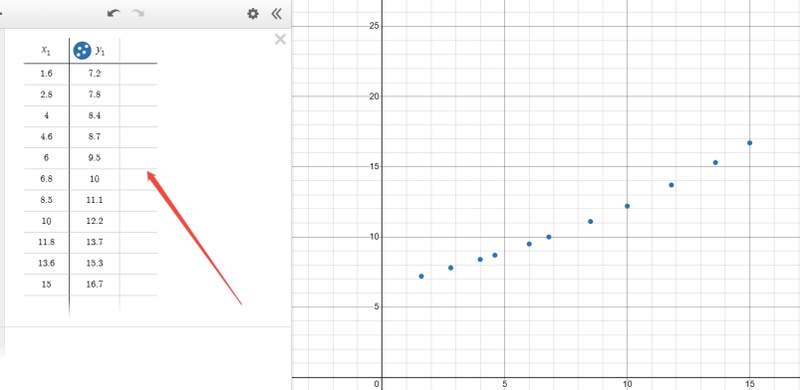
Suppose a question provides several coordinate pairs.
Start by adding a table and entering the x-values in the first column and corresponding y-values in the second.
Once the data is entered, Desmos allows you to add a regression and choose an appropriate model. Its built-in regression options can fit different relationships depending on the data.
If the problem tells you the relationship is linear, use a linear model.
A standard custom linear regression can be written as:
y₁ ~ mx₁ + b
Desmos then estimates values for m and b.
For a quadratic model, you might use:
y₁ ~ ax₁² + bx₁ + c
This gives values for a, b, and c.
Method 2: Use a Custom Regression
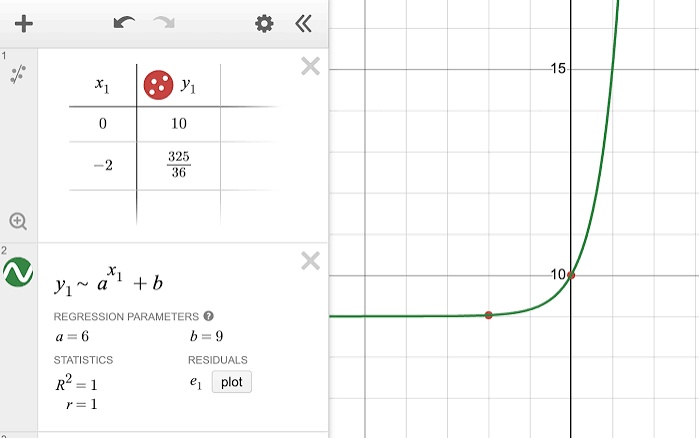
Custom regression becomes useful when the SAT gives you a specific equation form that does not match a standard model.
The important symbol is:
~
This is called a tilde.
In a custom Desmos regression, you replace the normal equals sign with the tilde and reference the data columns using variables such as x₁ and y₁.
Desmos's official regression documentation gives the same basic process: enter data in a table, write the desired model, replace = with ~, and allow Desmos to calculate values for the model parameters.
This technique is particularly useful when a problem gives several points and asks for constants in an unfamiliar equation form.
Method 3: Use Regression to Find Constants
Some SAT prep strategies extend custom regression beyond traditional scatterplot questions.
For example, when a question contains several unknown constants in an identity or equivalent-expression problem, it may be possible to construct a custom regression that lets Desmos estimate those parameters rather than manually expanding and matching coefficients. This is often called the "tilde trick" in SAT Desmos guides.
This is an advanced shortcut, so it should be practiced before test day. A small typing error can produce a completely different result.
Also remember that regression is fundamentally a modeling tool. Desmos notes that nonlinear regression uses numerical methods and can sometimes produce unexpected results or multiple possible parameter combinations.
For that reason, always check whether the result makes mathematical sense before selecting an answer.
Also Worth a Try: Tenorshare AI Math
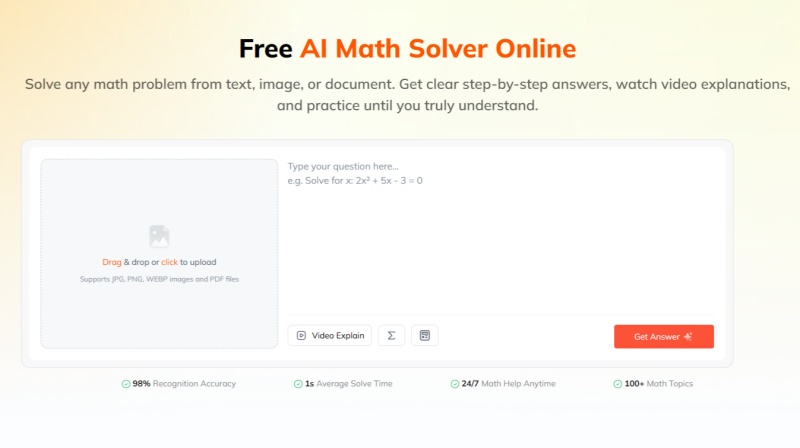
If you want extra support while practicing SAT Math, tools like Tenorshare AI Math can also be helpful. It is designed to handle math problems in a more learning-focused way, allowing you to input questions in different formats such as text, images, or even PDF files. This makes it convenient when you are working through homework, worksheets, or practice tests.
-
Multi-format input: Accepts text, images, and PDFs so you can quickly upload any SAT practice problem.
-
Step-by-step solutions: Breaks down each problem into clear steps to show how the answer is derived.
-
Visual explanations: Generates AI-based visuals or video-style breakdowns to help you understand complex concepts.
-
Practice generation: Creates similar follow-up questions after solving to reinforce learning immediately.
Unlike a calculator, it focuses more on learning support rather than just computation. You can input a problem and see how it is solved, which helps you understand patterns that often appear in SAT questions.
While it should not replace your own practice or Desmos skills, it can be a useful companion for reviewing difficult topics, building confidence, and following a more complete math learning workflow from solving to practice.
Conclusion
Learning how to use Desmos for SAT Math is less about memorizing dozens of calculator tricks and more about recognizing which problems become easier when represented graphically.
Instead of treating Desmos as a step-by-step solution tool, the real advantage comes from understanding when a visual or data-based approach can simplify a problem that would otherwise take longer algebraic work.
For realistic practice, it is best to use the calculator inside official Bluebook practice tests or the College Board testing version provided through Desmos. If you want to further strengthen your practice and build faster problem-solving skills, you can also try an AI math solver like Tenorshare AI Mathfor additional step-by-step training and reinforcement.
Tenorshare AI Math
- Solve math from text, images & PDFs at 98% accuracy
- Deliver step-by-step answers with detailed logic breakdown
- Access video explanations for deeper math concept understanding
- Generate matching practice tests to solidify knowledge

FAQs
-
Is Desmos Still Good on the SAT?
Yes. As of 2026, Desmos remains built into Bluebook for the SAT Math section. Students can switch between its scientific and graphing calculator options during Math. Its value depends on how you use it. Desmos is particularly helpful for graphing functions, finding intersections, analyzing data, and running regressions. It is less useful when a question can be solved faster with simple arithmetic or algebra.
-
Is Desmos Allowed on Every SAT Math Question?
Yes. Calculator use is permitted throughout the SAT Math section, and the embedded Desmos calculator is available during Math. There is no separate no-calculator Math module. That does not mean you should use Desmos on every question. College Board specifically notes that some questions are better completed without a calculator.
-
Can You Solve Every SAT Math Problem With Desmos?
No. Desmos can help with a large range of SAT Math problems, especially equations, functions, systems, graphs, data, statistics, and regression. But many questions still require you to understand mathematical relationships, translate word problems, choose appropriate formulas, or reason about geometry. Desmos is a problem-solving tool rather than a substitute for SAT Math knowledge.
-
What Are the Most Useful Desmos Features for the SAT?
For most students, the most practical Desmos features are graphing equations, finding intersections, identifying intercepts, working with tables, testing answer choices, graphing inequalities, using sliders, calculating statistics, and running regressions. You do not need to master every feature before taking the SAT. Focus on the tools that repeatedly appear in your practice.
-
How Long Does It Take to Learn Desmos for the SAT?
There is no fixed time required to learn Desmos for the SAT. Basic functions like graphing and finding intersections are easy to pick up quickly, while more advanced techniques such as regression or parameter testing take more practice. The best approach is to use Desmos consistently during SAT Math practice so it becomes natural by test day.
You Might Also Like
- What Happened to Microsoft Math Solver? Why It Was Discontinued and What to Use Instead
- How to Be Good at Math: A Complete Guide to Improve Your Math Skills
- How to Solve Math Word Problems Step by Step: Strategies, Tips & Tool
- Tenorshare AI Math Review 2026: Is It a Good AI Math Solver?
- Symbolab Calculator Review 2026: Is It Accurate, Free, and Worth It?
- Is Wolfram Alpha Math Solver Good for Math? A Complete Review
- Is Photomath Worth Using? Full Review of the Math Solver App

Tenorshare AI Math: Solve any math problems with AI
Turn math questions into clear solutions, tutorial videos & targeted practice setsTenorshare AI Math: Instant Solutions
Steps, videos & practice for every problem
Tenorshare AI Math: Solve any math problems with AI