
Descriptive vs Inferential Statistics: Differences, Examples & Uses
Do you need to report what your data shows, or use it to make a decision about a larger group? That is the key distinction behind descriptive vs inferential statistics .
Descriptive statistics help you summarize the data already collected, such as average survey scores, sales totals, or customer demographics. Inferential statistics go a step further, using a sample to estimate population values, test a hypothesis, or assess whether an observed difference is likely to be meaningful.
This guide explains the difference between descriptive and inferential statistics , the common methods used in each, and how to choose the right approach for your data question.
Catalogs:
Descriptive Statistics vs. Inferential Statistics: At a Glance
The clearest way to understand the difference is to compare the questions each approach is designed to answer.
| Aspect | Descriptive Statistics | Inferential Statistics |
|---|---|---|
| Primary purpose | Summarize and present observed data | Draw conclusions about a wider population or process |
| Core question | What does this dataset show? | What does this sample suggest beyond itself? |
| Typical outputs | Averages, percentages, charts, distributions | Confidence intervals, hypothesis tests, p-values, model estimates |
| Role of uncertainty | Reports known values in the dataset | Measures uncertainty when extending findings beyond the dataset |
| Common applications | Dashboards, reports, survey summaries | Experiments, research studies, polling, A/B tests |
Put simply, descriptive statistics tell the story of the data you observed. Inferential statistics help assess whether that story is likely to hold for a larger group.
What Is Descriptive Statistics?

Descriptive statistics are used whenever raw data needs to be organized into a form that people can understand and use. They do not predict future outcomes or make claims about people who were not measured. Instead, they summarize the characteristics of the data already available .
For example, a school may want to understand the results of one exam. Rather than reviewing every individual score, it can report the class average, the middle score, the score range, and a chart showing how results are distributed. Those summaries make the data more useful without changing what the data says.
Descriptive Statistics Meaning
The descriptive statistics meaning is straightforward: they describe the observed data as it is .
They show what is typical, how widely values vary, and how often particular values or categories occur. The most suitable measure depends on the type of data and the question being asked.
Common descriptive measures include:
-
Mean, median, and mode to show a typical or central value
-
Range, variance, and standard deviation to show how spread out the data is
-
Counts, proportions, and percentages to show frequency
-
Tables and charts to reveal patterns, comparisons, and distributions
One important point is often missed: descriptive statistics can be used for either a sample or a full population. A survey of 200 customers can be described with averages and percentages just as a complete customer database can. The analysis remains descriptive as long as it does not use those results to make claims beyond the data observed.
If you are still learning how these measures are calculated, an AI math solver can help you work through the steps behind measures such as the mean, standard deviation, and percentages before you interpret the results.
Examples of Descriptive Statistics
Examples of descriptive statistics appear in everyday reports and decisions:
-
A retailer reports that its average order value was $62 last month.
-
A teacher finds that the median exam score in a class was 78%.
-
A hospital summarizes the age range and most common diagnoses among its patients.
-
A website dashboard shows that 64% of visitors used a mobile device.
-
A histogram shows whether customer satisfaction ratings cluster around high, low, or mixed scores.
These results are valuable because they turn a large set of records into information that can be quickly interpreted. However, they only describe the specific people, events, or measurements included in the dataset.
What Is Inferential Statistics?
Inferential statistics are used when the data you have is only part of the picture.
In practice, it is often impossible or too costly to collect information from every member of a population. A researcher cannot always survey every voter, test every product, or measure every potential patient. Instead, they collect a sample and use statistical methods to estimate what may be true in the larger population.
This process always involves uncertainty. A sample may differ from the population simply by chance, and poor sampling can introduce bias. Inferential methods are designed to make that uncertainty visible rather than ignore it.
Inferential Statistics Meaning

The inferential statistics meaning refers to using sample data to estimate population characteristics, test hypotheses, or examine whether an observed relationship is likely to extend beyond the sample.
For instance, a company may survey 500 customers and estimate the proportion of all customers who are satisfied. A clinical researcher may compare two treatment groups to assess whether a difference in outcomes is likely to reflect more than random variation. In both cases, the aim is not merely to describe the collected records, but to make a carefully qualified conclusion about a broader group.
Common inferential tools include:
-
Confidence intervals , which show a plausible range for a population value based on the sample and method used
-
Hypothesis tests , which evaluate how compatible the observed data is with a stated assumption
-
t-tests and ANOVA , which compare group averages
-
Regression analysis , which examines relationships between variables and can estimate or predict outcomes
-
Correlation analysis , which measures the direction and strength of an association
Inferential statistics are only as reliable as the data and design behind them. Representative sampling, an adequate sample size, sound measurement, and appropriate statistical assumptions all matter.
Inferential Statistics Examples
Inferential statistics examples usually involve a sample-to-population question. They include:
-
Estimating national approval of a policy from a survey of eligible voters
-
Testing whether a new teaching method produces different average results from the current method
-
Estimating the average delivery time for all orders using a sample of recent deliveries
-
Assessing whether a marketing campaign changed conversion rates in an A/B test
-
Examining whether a relationship between exercise and blood pressure is likely to exist in a broader population
The wording matters. Inferential findings should be presented as estimates or evidence, not as certain proof. A result can be statistically significant while still being too small to matter in practice, and a well-run analysis cannot fully compensate for a biased sample.
The Main Difference: Describing Data vs. Making Inferences
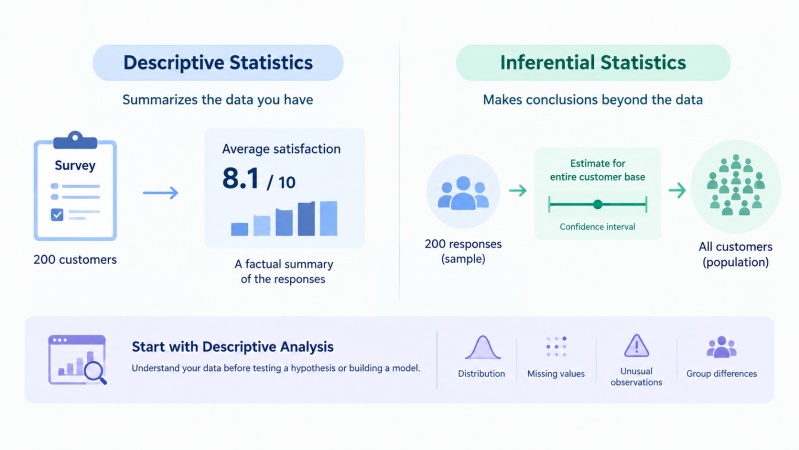
The difference between descriptive and inferential statistics becomes clear when you ask one question: does the analysis stay within the observed dataset, or does it extend beyond it ?
Suppose a company surveys 200 customers and finds that their average satisfaction score is 8.1 out of 10. Reporting that average is descriptive statistics. It is a factual summary of the responses received .
Now suppose the company wants to estimate satisfaction among its entire customer base . It may use the 200 responses as a sample, calculate an interval estimate, and consider whether the sample was representative. That is inferential statistics because the conclusion goes beyond the 200 respondents.
This distinction also explains why descriptive statistics should come first in many analyses. Before testing a hypothesis or building a model, you need to understand the data: its distribution, missing values, unusual observations, and group differences. Descriptive analysis provides that foundation.
When Should You Use Descriptive vs Inferential Statistics?
The choice comes down to the scope of your question. Use descriptive statistics when you need to explain the data you have. Use inferential statistics when you need that data to support a conclusion about a larger group, a future decision, or a possible effect.
Use Descriptive Statistics When
Use descriptive statistics when the dataset itself is the subject of the report .

For example, a marketing team reviewing last quarter's performance may want to know which channels generated the most leads, what the average cost per acquisition was, and how results varied by region. A dashboard that summarizes these figures with totals, averages, percentages, and charts is descriptive because it reports what happened during that period.
Descriptive statistics are also useful at the start of a research project . Before testing a hypothesis, researchers often summarize participant age, baseline characteristics, missing values, and outcome distributions. This provides essential context and can reveal issues that need attention before further analysis.
Use Inferential Statistics When
Use inferential statistics when the observed data is evidence for a question that extends beyond the records you currently have .

For instance, a public health researcher may survey a sample of residents to estimate the prevalence of a condition across an entire city. A retailer may test two versions of an email campaign with selected customer groups and ask whether the difference in conversion rates is likely to persist across its broader audience. In both cases, the goal is not only to describe the sample, but to make a decision or conclusion about a larger population.
Because these conclusions depend on a sample, the quality of the sampling process, study design, and statistical assumptions all affect how much confidence the result deserves.
A Simple Example: From Survey Results to a Decision
Consider a software company that asks 200 users to rate a new feature after launch.
The product team first uses descriptive statistics to understand the feedback it received. It finds that 72% of respondents are satisfied, the average rating is 8.1 out of 10, and new users give more mixed ratings than long-term users. These findings show where the feature appears to perform well and where the experience may need improvement.
The team then faces a different question: should the feature be released to every user?
Answering that requires inferential statistics . The team could compare the test group with a similar control group, estimate the likely size of the improvement, and report a confidence interval around that estimate.
The two approaches therefore serve different stages of the same decision . Descriptive statistics explain the feedback received; inferential statistics help determine whether that feedback is strong enough to guide a wider rollout.
Final Verdict: Inferential vs Descriptive Statistics
Descriptive vs inferential statistics is best understood as a difference in purpose.
Descriptive statistics make data easier to see and understand. They summarize what was observed through measures such as averages, percentages, variation, and charts. Inferential statistics use sample data to estimate, compare, or test claims about a wider population while accounting for uncertainty.
Neither approach is inherently better. If you only need to describe what happened, a clear descriptive summary may be the most useful result. If you need to generalize from a sample, evaluate a treatment, or make a decision under uncertainty, inferential methods provide the appropriate framework.
In many real-world analyses, the strongest approach is to use both: describe the data first, then make inferences only when the data and research design support them.

Tenorshare AI Math
- Solve math from text, images & PDFs at 98% accuracy
- Deliver step-by-step answers with detailed logic breakdown
- Access video explanations for deeper math concept understanding
- Generate matching practice tests to solidify knowledge

FAQs
-
Is ANOVA Descriptive or Inferential Statistics?
ANOVA, or analysis of variance, is generally an inferential method. It is used to assess whether average outcomes differ across groups in a broader population. The group means and standard deviations reported alongside an ANOVA are descriptive statistics, but the test itself is inferential.
-
Is Regression Descriptive or Inferential Statistics?
Regression can serve either purpose. It can describe the relationship between variables in a specific dataset, or it can be used inferentially to estimate population relationships, test hypotheses, and make predictions beyond the observed sample. Its role depends on the research question and how the results are interpreted.
-
Can Descriptive and Inferential Statistics Be Used Together?
Yes. They are frequently used in sequence. Descriptive statistics help analysts understand the data, identify patterns, and check quality. Inferential statistics can then be used to evaluate whether those patterns support conclusions about a broader population.
-
What Is the Purpose of Descriptive Statistics?
The purpose of descriptive statistics is to summarize data clearly and accurately. They reveal typical values, variation, frequencies, and distributions, helping people understand a dataset without making unsupported claims beyond it.
-
What Are the Main Types of Descriptive Statistics?
There is no single universal list of four types, but descriptive statistics are commonly grouped into measures of central tendency, measures of variability, frequency measures, and measures of distribution or shape. Tables and visualizations are also central tools because they make patterns easier to interpret.
You Might Also Like
- Is Statistics Harder Than Calculus? Which Should You Take? [2026]
- Why Is Statistics So Hard to Understand? 5 Real Reasons
- Is AP Statistics Hard? A Complete Guide to AP Stats Difficulty [2026]
- How to Get Better at Mental Math: Practical Strategies and Daily Practice
- How to Get Better at Math Fast: 8 Strategies to Improve Your Skills
- How to Solve a Hard Math Problem: A Simple Guide for Students

Tenorshare AI Math: Solve any math problems with AI
Turn math questions into clear solutions, tutorial videos & targeted practice setsTenorshare AI Math: Instant Solutions
Steps, videos & practice for every problem
Tenorshare AI Math: Solve any math problems with AI